
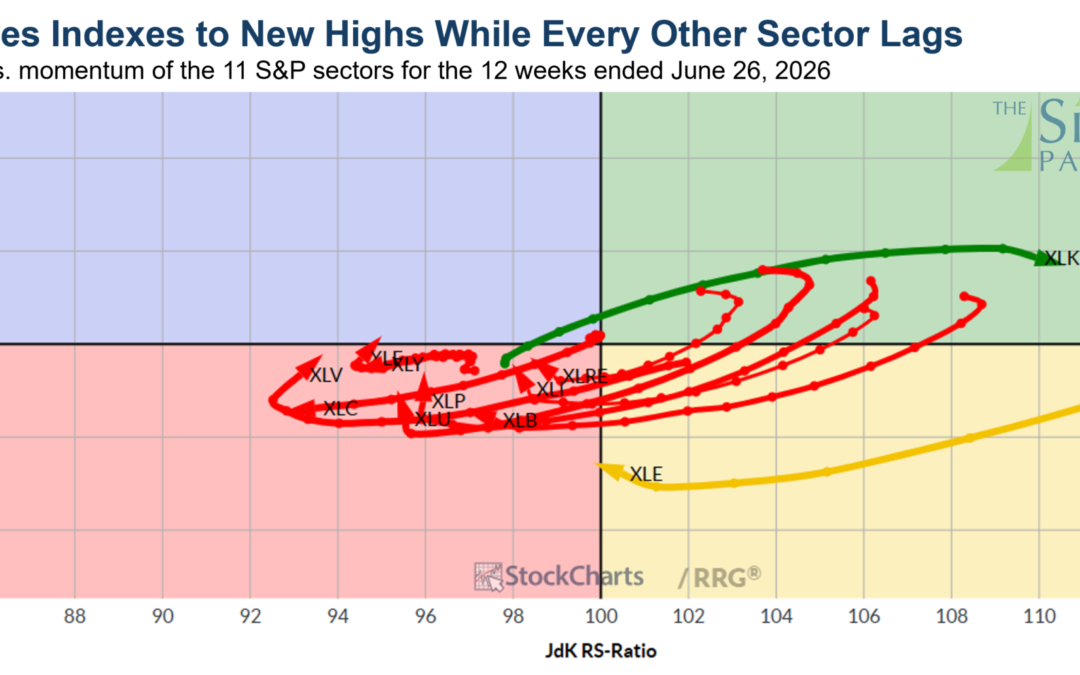
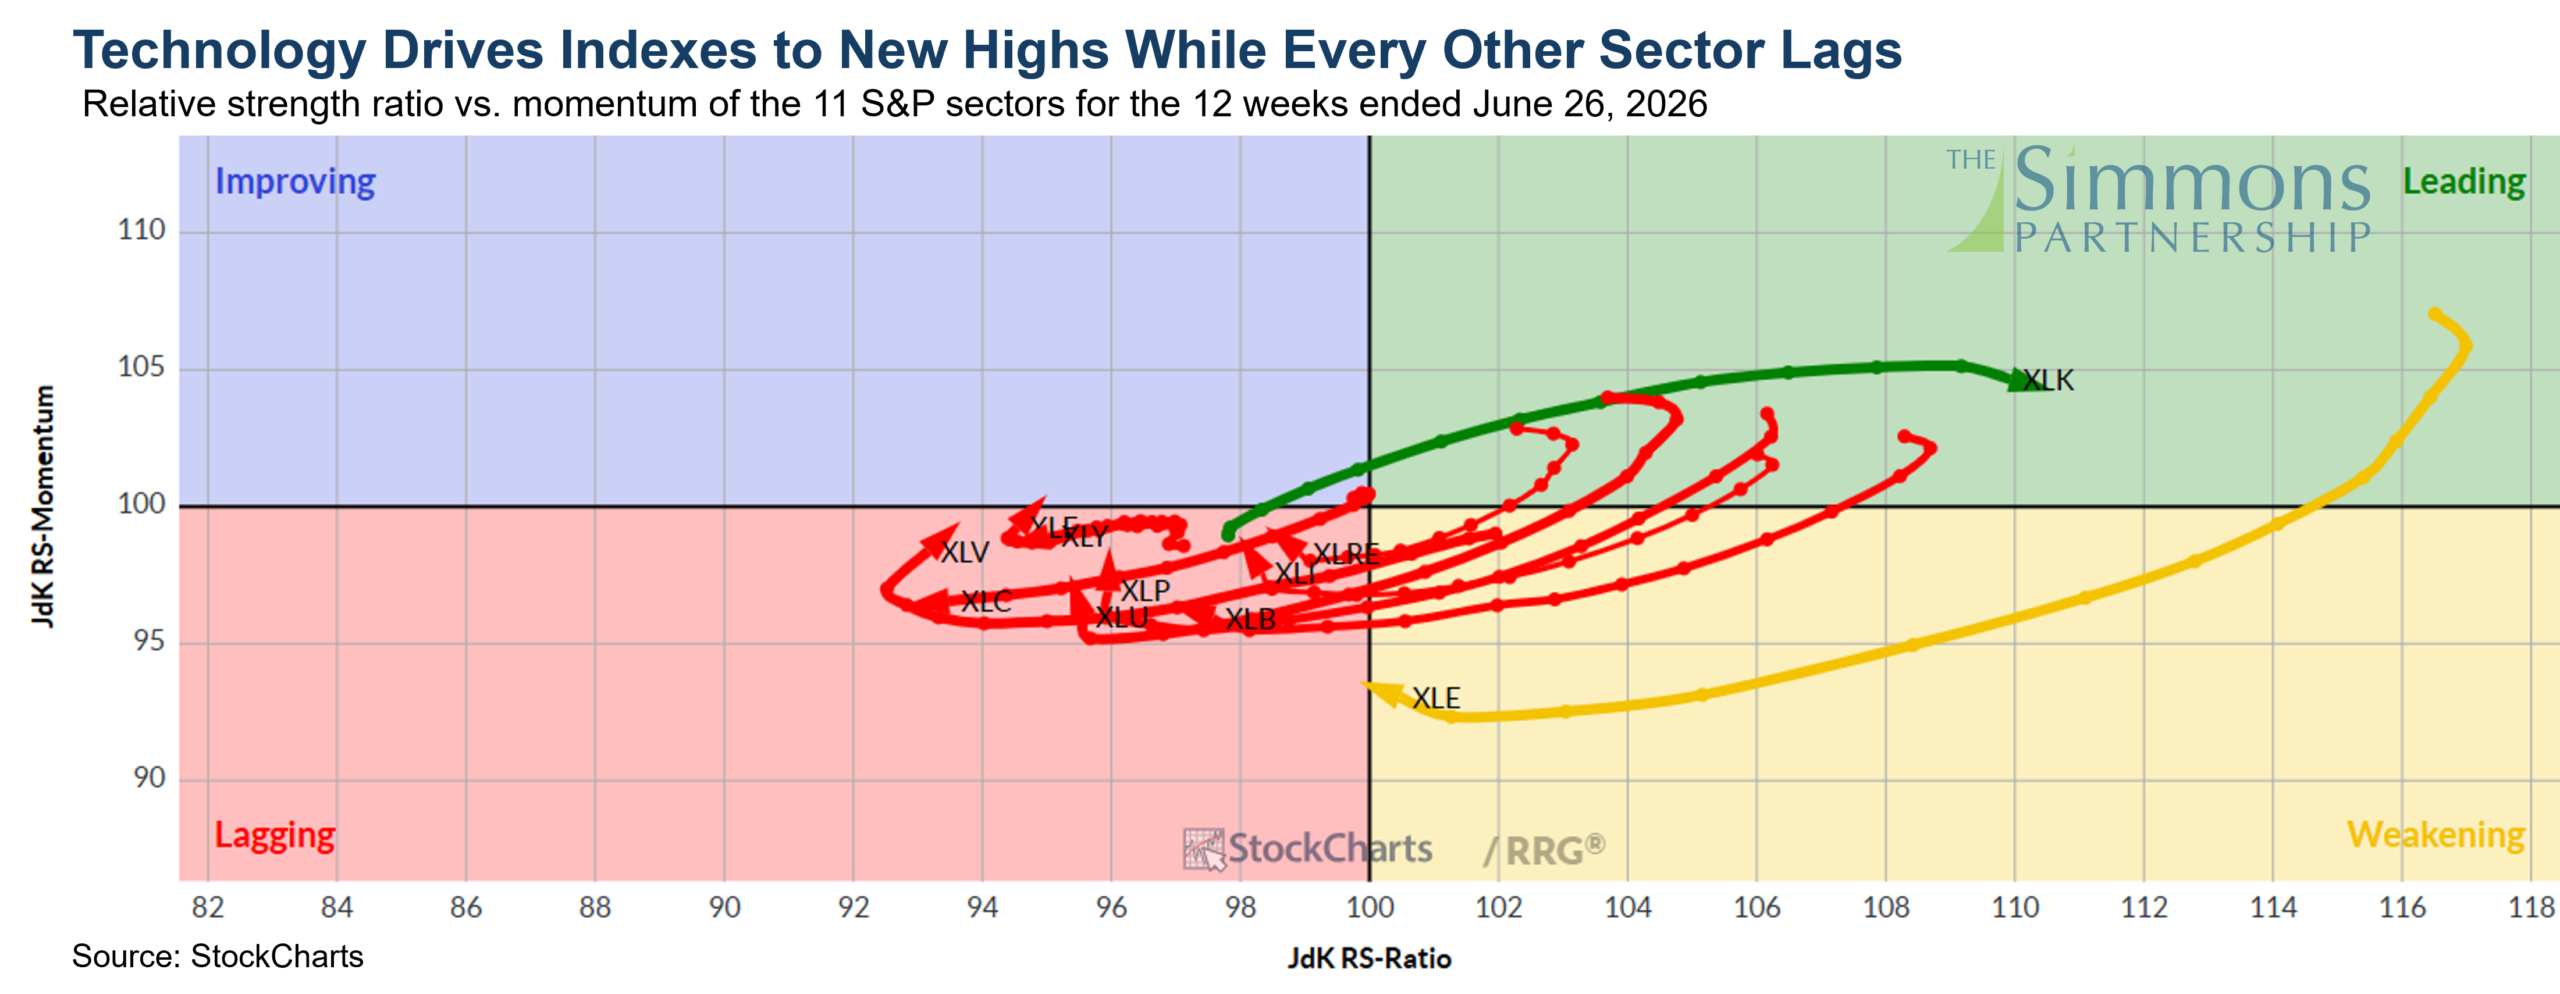
StockCharts RRG chart from June 26, 2026, mapping JdK RS-Ratio vs JdK RS-Momentum for the 11 major S&P 500 sectors. The data demonstrates a strong leading trend for Technology (XLK) while sectors like Energy (XLE), Financials (XLF), and Consumer Discretionary (XLY) lag behind or weaken.
Recent Posts
- Market Insights: Narrow Market Leadership and Lack of Breadth June 30, 2026
- Government Employee Retirement Planning Maryland | The Simmons Partnership June 22, 2026
- The Simmons Partnership: Frequently Asked Questions May 29, 2026
- Recession Signals Rising: Inflation, Weak Labor Market & Oil Shock April 17, 2026
- Fed Rate Cuts Would Risk Repeating the Mistakes of the 1970s March 19, 2026

